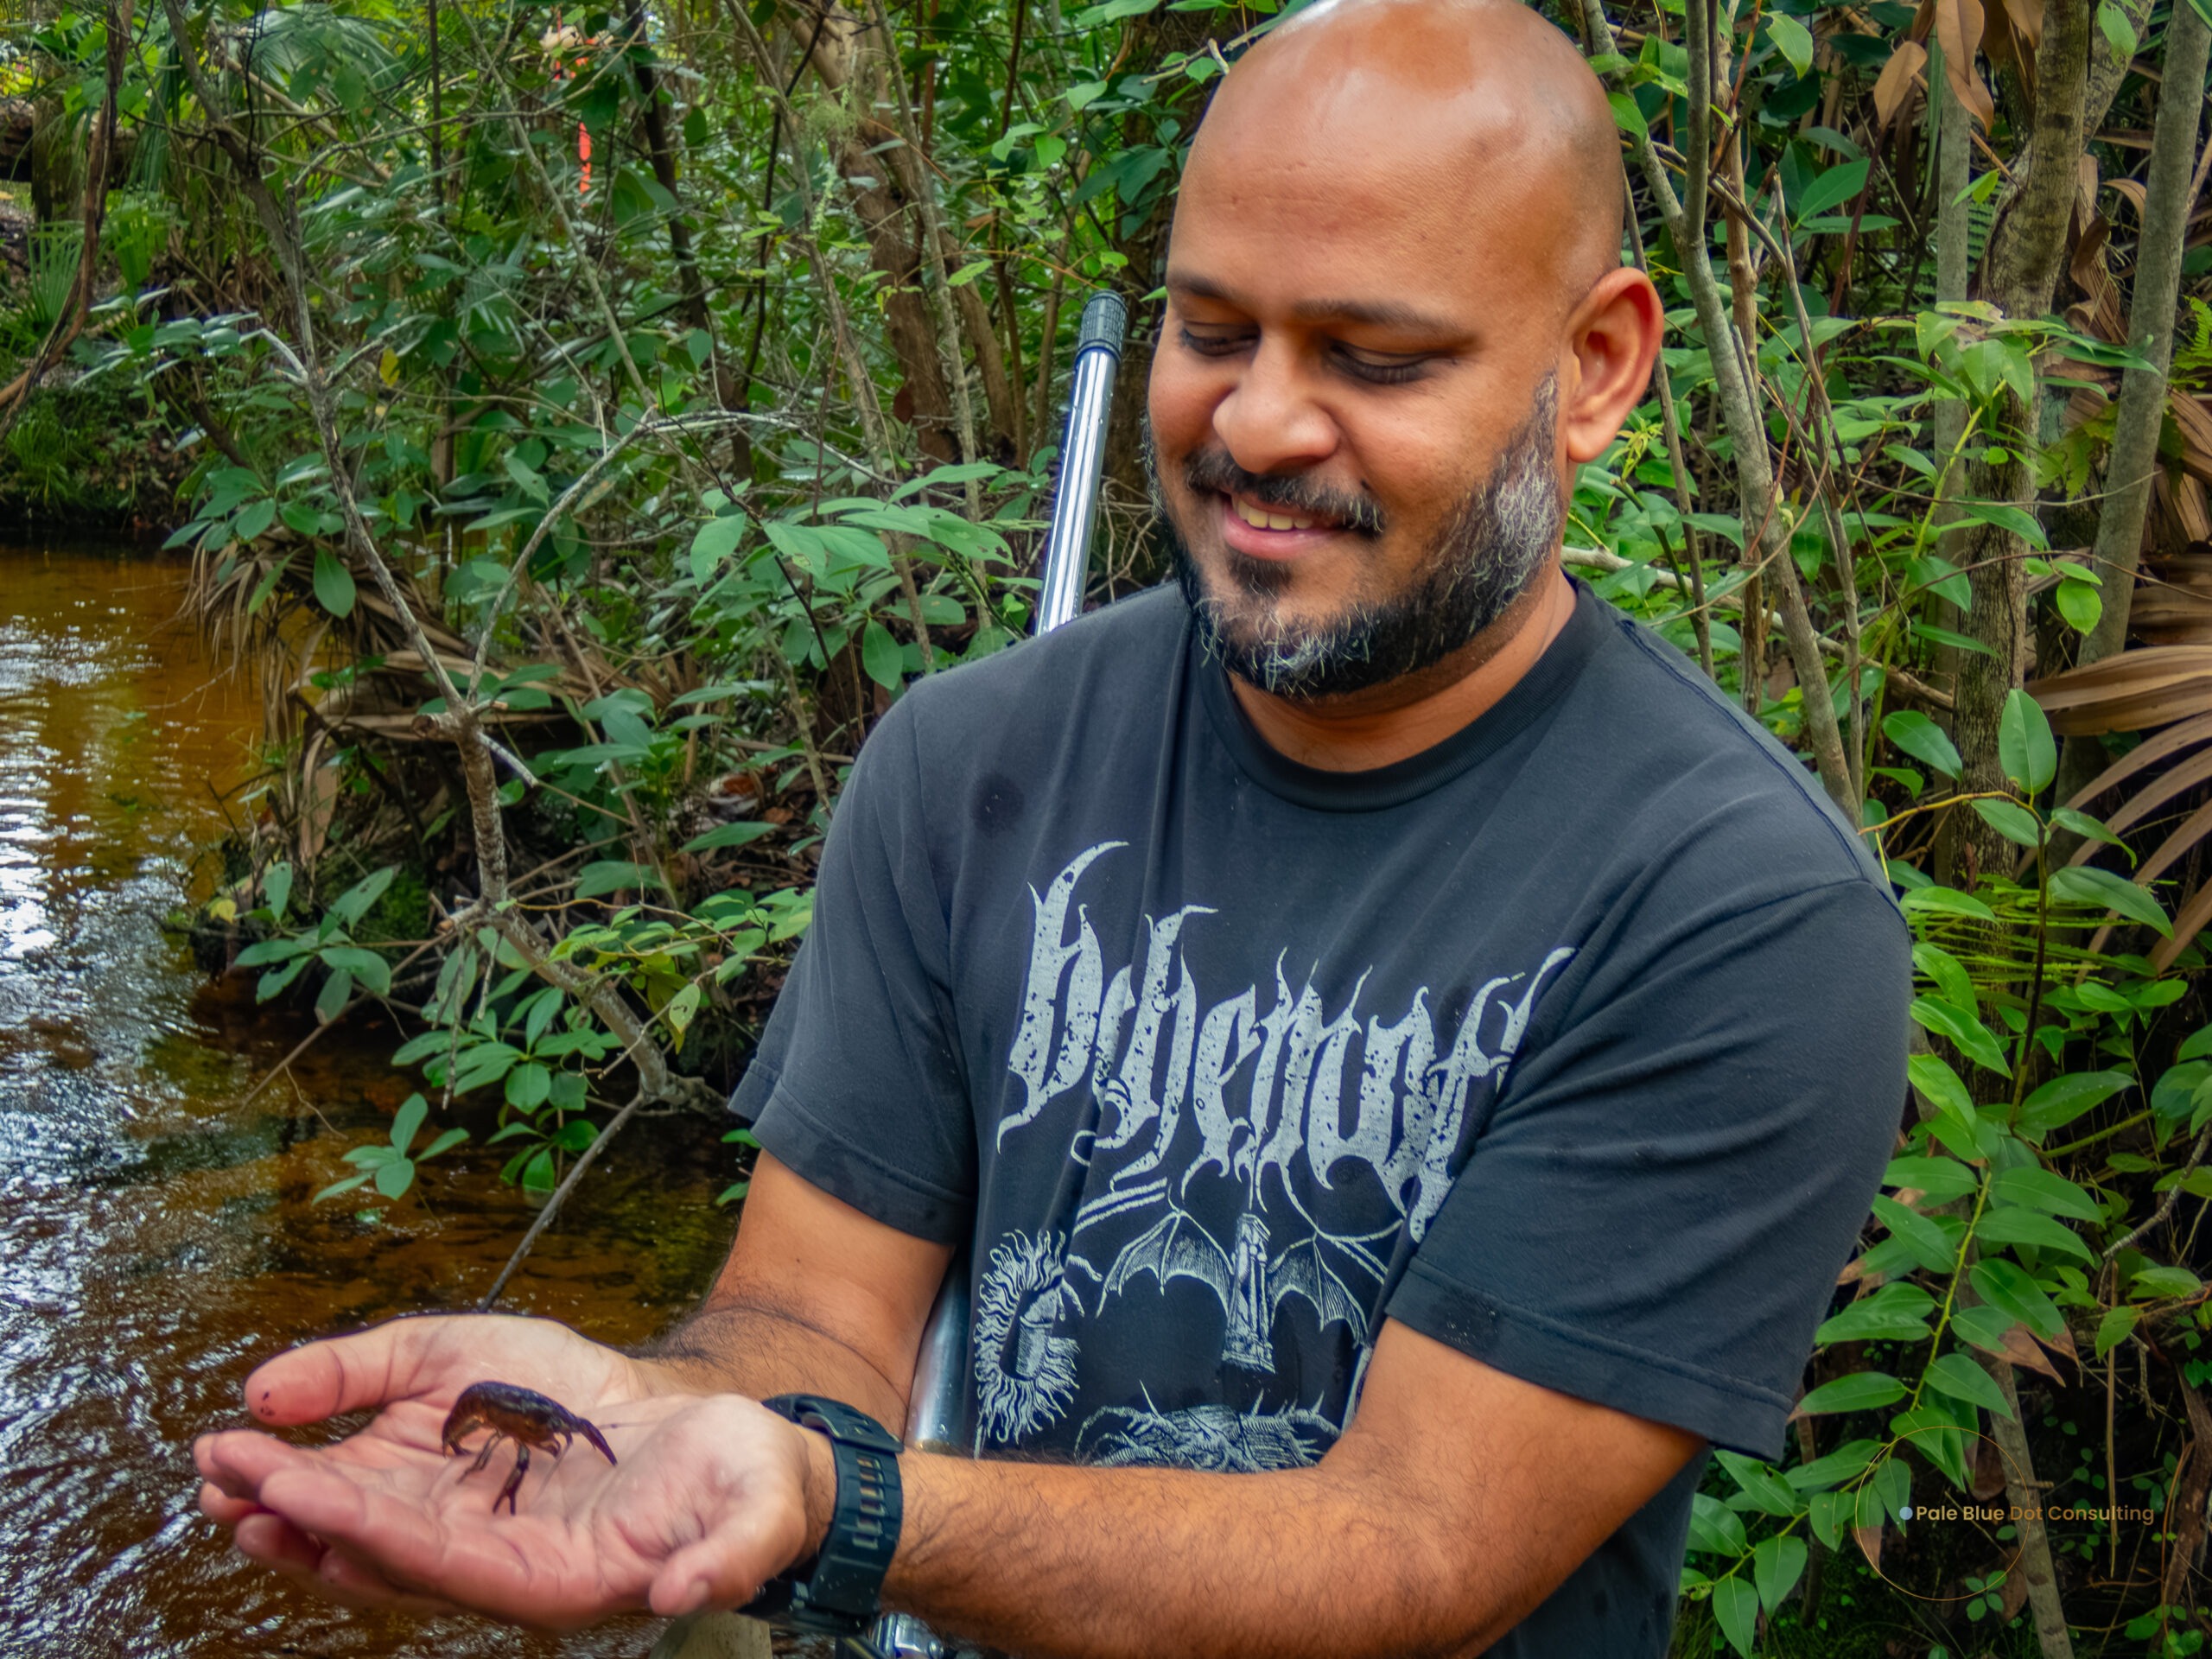
Using Biology to Check the Pulse of Florida’s Streams
When most of us think about water quality, we think about cloudy water, green algae, or maybe fish floating on the surface. While these signs can be concerning, they are usually the last to show up, long after a problem has started.
In Florida, one of the best ways to get an early warning about a stream’s health is by looking at something most people never see: the tiny “bugs” living at the bottom of the creek. These are called aquatic macroinvertebrates, small critters without backbones that you can see with your naked eye. They live among the sand, leaves, roots, rocks, and plants in the water.
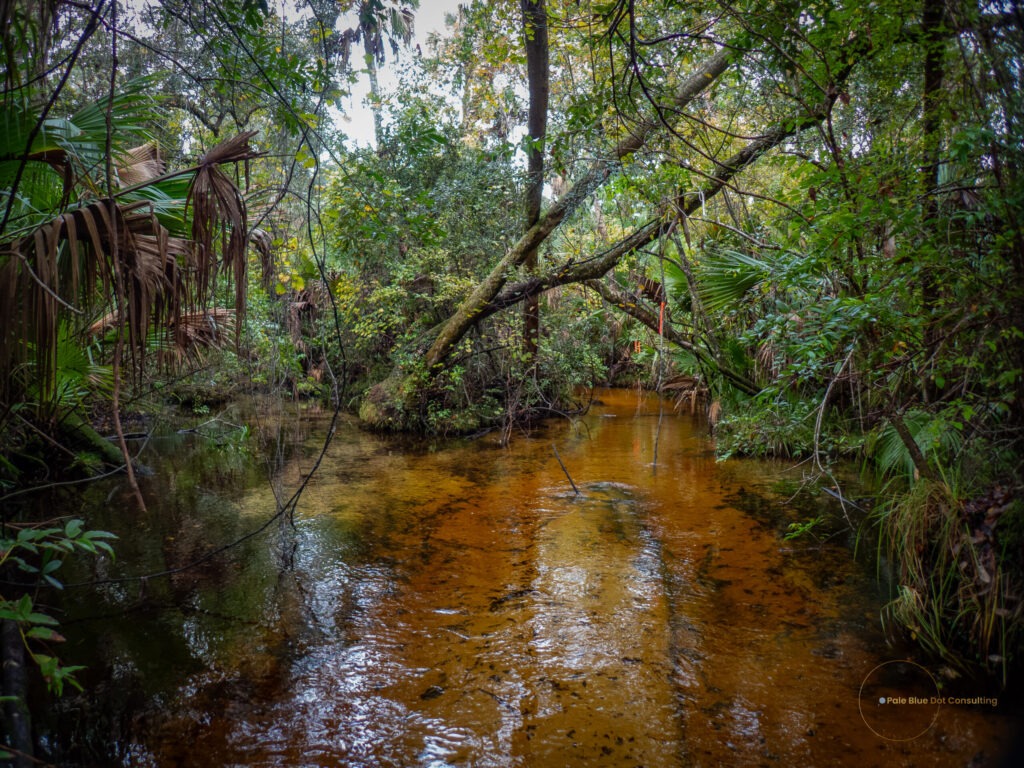
Examples of these stream-bottom “bugs” include:
– Mayfly larvae
– Stonefly larvae
– Caddisfly larvae
– Hellgrammites (Dobsonfly larvae)
– Midge larvae
– Water scorpions
– Dragonfly and damselfly larvae
– Beetle larvae
– Snails
– Aquatic worms
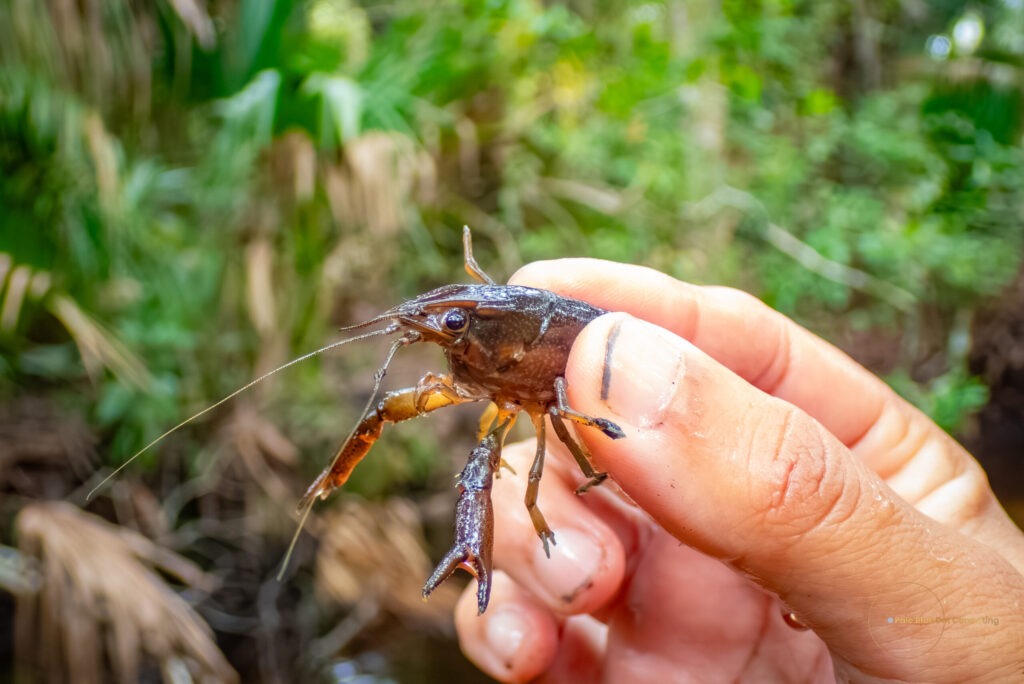
– Crayfish and shrimp
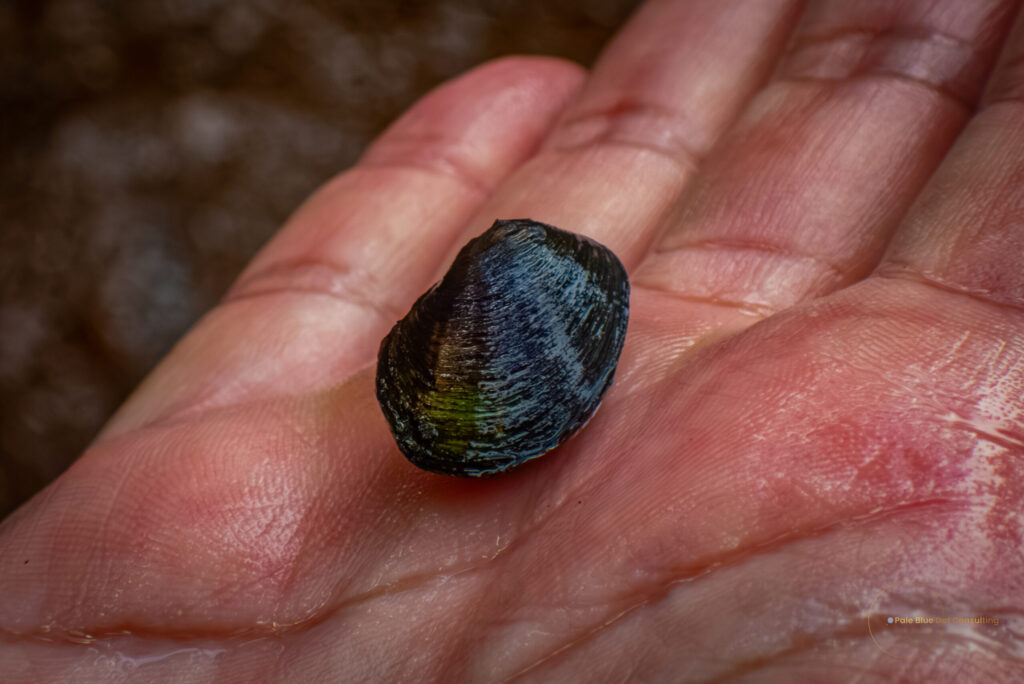
– Clams and mussels
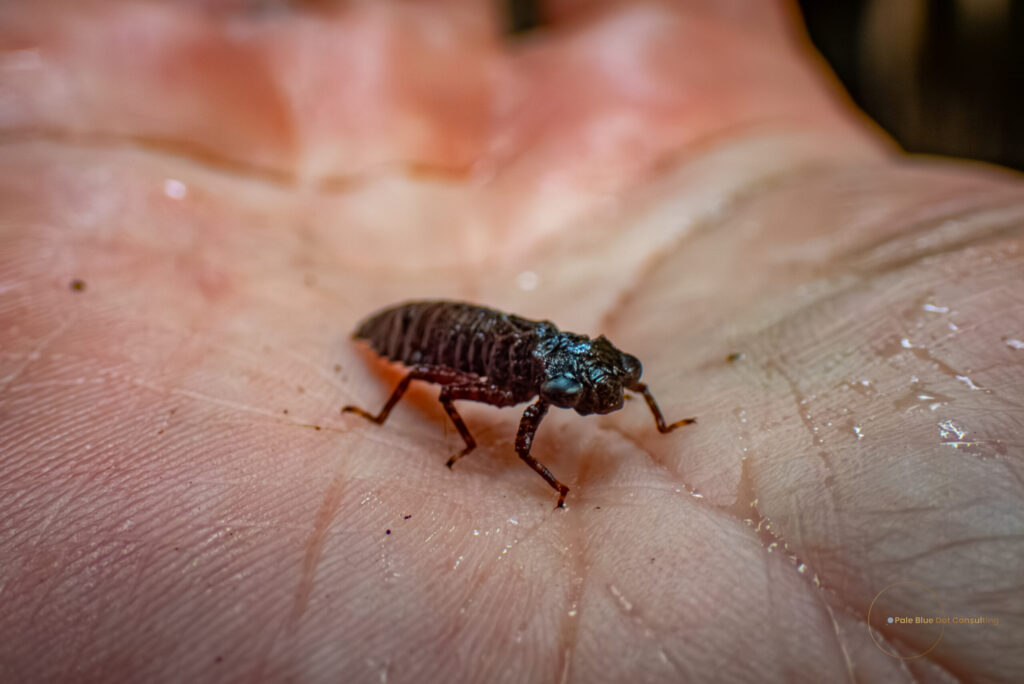
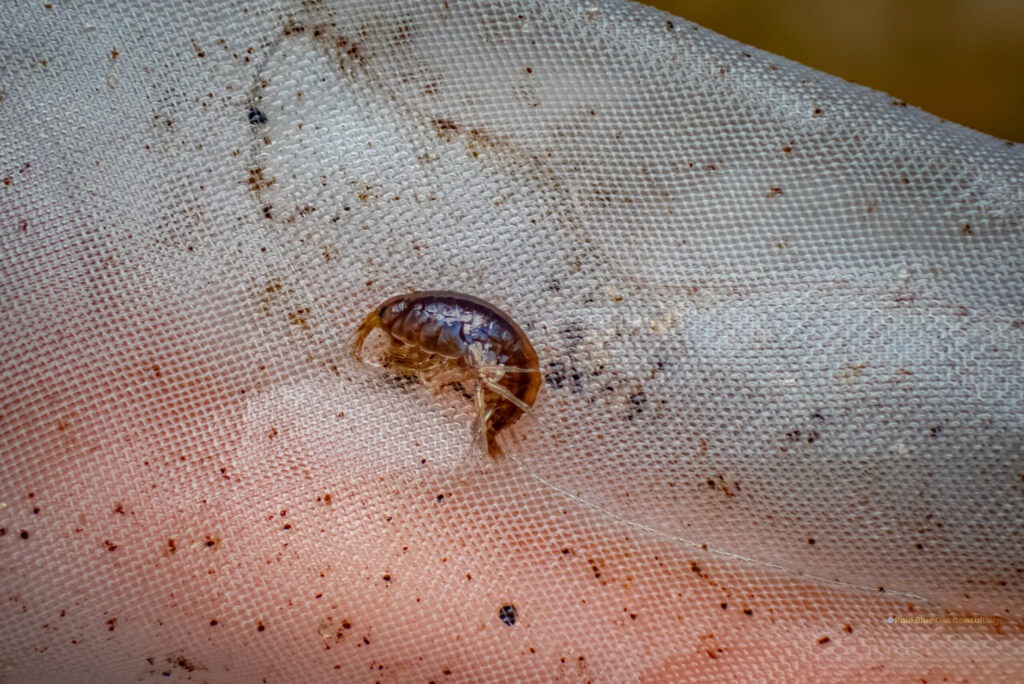
Note: Mosquito larvae are only semi-aquatic because they have to come up for air.
Why Macroinvertebrates Are Great Indicators
The types of aquatic macroinvertebrates living in a stream depend on what the water is like. Some bugs need clean, oxygen-rich water and stable habitat to survive; they are the picky ones. Others are more tough and can handle polluted water (to a point) or muddier bottoms.
Think of it like a neighborhood. If the neighborhood gets noisy and polluted, the picky families move away, and only the tough ones stay. By checking which bugs are present and which are missing, scientists can spot trouble early. Because these bugs live in the water for months or even years, they act like a historical record. They do not just tell us if the water is bad today; they tell us if it has been stressed over the last several months.
In fact, stream bug communities can show signs of stress in watersheds where only 5 percent of the land has been developed.
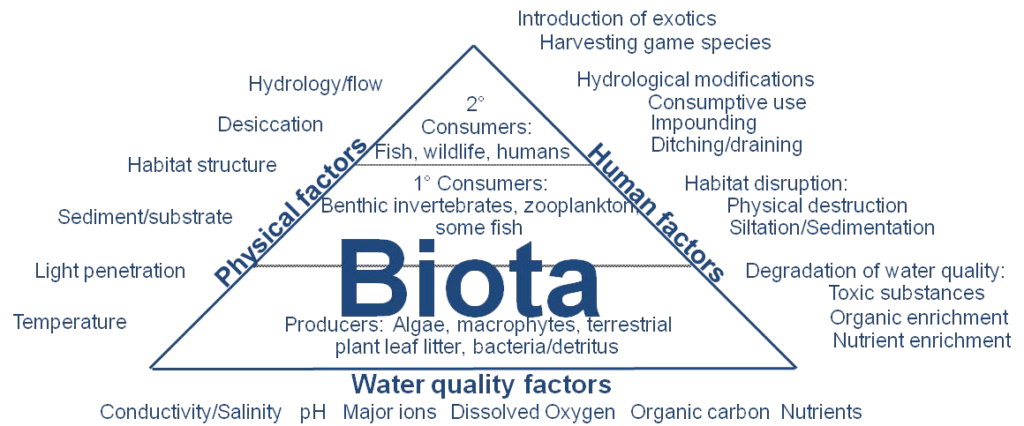
Figure 1: Factors Affecting Macroinvertebrate Communities (DEP 2024)
What is the Stream Condition Index (SCI)?
The Stream Condition Index (SCI) is Florida’s official report card for freshwater streams. Managed by the Florida Department of Environmental Protection (DEP), the SCI looks at the bug community to determine if a stream is healthy.
For regulators, it is used as legal evidence to decide if a stream is meeting its intended purpose (see Table 1), such as being safe for swimming or fishing.
For communities and project teams, it provides a clear, fair picture of whether a stream is in good shape.
Table 1 Florida Surface Water Designated Uses
| Class | Designated Use |
| I | Potable (Drinking) Water Supplies |
| II | Shellfish Propagation/Harvesting |
| III | Fish Consumption, Recreation, Propagation and Maintenance of a Healthy, Well-Balanced Population of Fish and Wildlife |
| III-limited | Fish Consumption; Recreation or Limited Recreation; and/or Propagation and Maintenance of a Limited Population of Fish and Wildlife. This classification is restricted to mostly man-made waterbodies which typically have limited aquatic life support and habitat that prevent attainment of Class III uses, e.g. canals |
| IV | Agricultural Water Supplies. Generally located in agriculture areas around Lake Okeechobee. |
How the SCI Report Card Is Created
The SCI process follows a strict recipe to ensure fairness. A team of trained experts visits a stream and collects macroinvertebrates from different underwater habitats (e.g., rocks, sand, plants, snags, roots, leaf packs) to get a good representation of the whole neighborhood.
They also take notes on the stream’s condition: how much plant life is on the banks, the shape of the stream, and the quality of the habitat.
Back in the lab, experts identify the bugs. They then use a set of math formulas (metrics) to measure:
– Diversity: How many different types of bugs are there?
– Balance: Is it a good mix, or are there too many of the tough bugs?
– Sensitivity: How many of the picky bugs are present?
These numbers are combined into a single final SCI score between 0 and 100.
What the SCI Score Means
The score generally works like a grade in school:
– 0 to 34 (Impaired): Failing. The stream is in significant stress.
– 35 to 67 (Healthy): Passing. The stream is functioning well.
– 68 to 100 (Exceptional): Excellent. The stream is in top condition.
The rule of thumb: For a stream to officially pass in Florida, the average of at least two tests (done at least 90 days apart) must be 40 or higher, with neither score dropping below 35.
A note on failing: If a stream scores in the Impaired range, it does not automatically mean someone broke the law. It means we have a health warning, like a check-engine light in your car. It tells us we need to look closer to find the root cause.
Why the SCI is a Better Test Than Just Chemistry
Water chemistry tests (like checking for fertilizers or metals) are like taking a single snapshot; they only tell you what is happening at that exact moment you take the water sample.
The SCI is like watching a video over time. It captures the cumulative effects of:
– Stormwater runoff (from roads and parking lots).
– Sediment washing in (mud covering the bottom).
– Changes in water flow.
– Changes in land use.
Because of this, the DEP uses SCI data to decide which streams need restoration, prioritize funding, and evaluate if permits are working.
Finding the Source of the Problem
One of the best things about the SCI is that it can help pinpoint where the trouble is coming from.
– Location: If a stream scores well upstream (at the top) but poorly downstream (at the bottom), it suggests something is entering the water between those two points, from a pipe, a farm, or a development.
– Time: Sampling the same spot over several years can show us if conditions are getting better after a restoration project, or worse due to new construction.
When you combine SCI scores with chemical tests and weather data, it becomes a powerful detective tool for solving water quality mysteries.
Why Hire Professionals to Do This?
Collecting bugs for an SCI is not just about grabbing a net and scooping. It requires:
1. Specialized Training: Knowing exactly where and how to sample.
2. Microscope Skills: Identifying bugs down to the species level (they often look identical to the untrained eye).
3. Data Interpretation: Understanding what the numbers mean for the specific stream location.
Are There Limitations?
Yes. The SCI was designed for natural streams, not concrete drainage canals, heavily dredged ditches, or coastal areas affected by tides. It can also be expensive due to the lab work. However, despite these limitations, it remains the most widely respected and legally accepted biological test in Florida.
Listening to the Stream
Streams often get sick before they look sick. The SCI gives us the ability to listen to the bugs, the biological signals in the water, so we can act early and fix problems before they become irreversible.
By using SCI assessments, communities and engineers gain a clear understanding of stream health, helping us protect Florida’s freshwater resources for the future.
Our firm is certified to conduct all of Florida’s biological assessments methods including the SCI, the Lake Vegetation Index (LVI), the Wetland Condition Index (WCI), Aquatic Habitat Assessment, Rapid Periphyton Survey (RPS), Linear Vegetation Survey (LVS), and Stream Biorecon. We have performed this work throughout Florida to support permitting, compliance, restoration planning, and even to help communities living near rivers, creek, and lakes track the health of their water body over time and the performance of their protection and conservation methods.